Toronto Parking Ticket Data Analysis and Visualization
Project Description
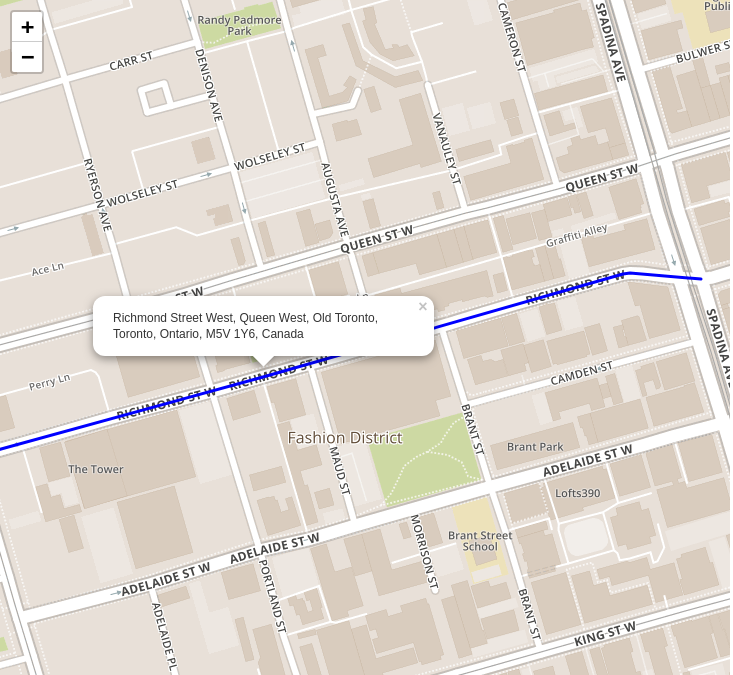
An interactive visualisation of parking ticket data published by the Toronto Open Data Catalogue, using 2016 data. Analysis was done in Julia, and visualization and interactivity with Leaflet.js. Users can view parking ticket data by finding and clicking on a street.
At the moment, the actual application is not hosted. Under active construction!
Notable Technology
- Julia
- Leaflet.js
- Nominatim